
")
South Korea Video Game Market & Forecast, by Category (Mobile, Download, Online Games, Gaming Networks), Users, Age Group, Gender, Income, Company Analysis
Get Free Customization in this Report
South Korea is the world's 4th largest market for video games. About half the population of the country plays games on their smartphone. From the past several decades, gaming has been a staple of South Korean culture. South Korea teenagers and adults have habits of playing games and heads towards nearby LAN game centre, after school. South Korea deeply embedded competitive gaming has become a mass culture, making it an excellent breeding environment for a vibrant and highly lucrative pro-gaming scene. According to Renub Research analysis, the South Korea Video Game Market will be US$ 9.8 Billion by the year 2026.

After the host of 2nd World Cyber Games in South Korea in 2002, the government has become serious regarding the video game industry in the country. Before the adoption of professional gaming in other parts of the world, the South Korean government had devoted television channels too early so that the Korean country would lead the world. Internet cafés, called PC bangs, are essential locations for young adults in their social life. They go there to play games, talk and socialize on camera.
The video game's main problems are its addiction; many studies in Korea have shown the link between video game addiction and psychological disorders like depression and anxiety. Thus, the Korean government has invested substantial sums in new hospitals, programs, and community groups to reduce the problem due to concerns of widespread video game addiction affecting players' health protection and despite numerous accidents related to it. The government took a measure and enforced the Cinderella Act that bans on playing video games from midnight to early morning.
South Korea largest giant Netmarble Games, launched its new mobile MMORPG, A3: Still Alive, which was available for local users since March 2020. Another largest video games giant Nexon launched its new mobile role-playing game V4 in September 2019, which was company's most highly anticipated massively multiplayer online role-playing games. By this, the company aims to attract users in local as well as abroad as seeing other mobile action games like HIT and OVERHIT.
Renub Research report titled “South Korea Video Game Market & Forecast, by Category (Mobile Games, Download Games, Online Games, Gaming Networks), Users (Mobile Games, Download Games, Online Games, Gaming Networks), Age Group (18-24, 25-34, 35-44, 45-54, 55-64), Gender (Male, Female), Income (Low Income, Medium Income, High Income), Company (Netmarble Corp., Gravity Co. Ltd., DoubleU Games, Activision Blizzard, NHN Entertainment Corp.)” studies the Korea video game industry. This report provides an all-encompassing analysis of the key growth drivers and restraining factors, demand, and their projections for the upcoming years.
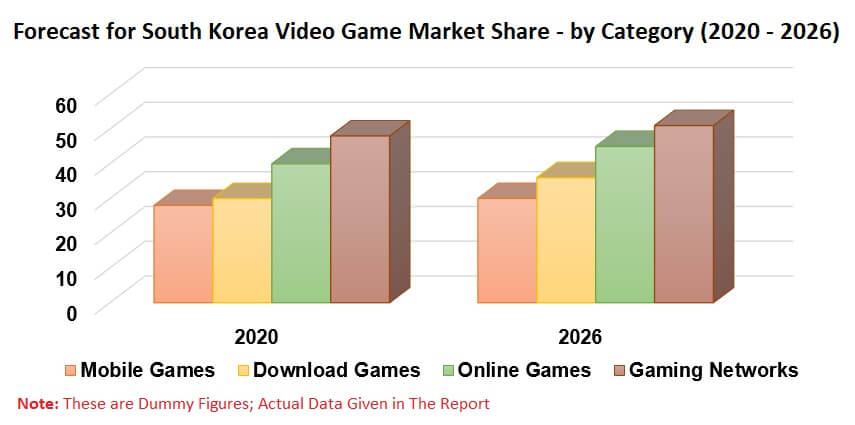
Category & Users – The Report Studies the Market and Number of Users of the 4 Segments
1. Mobile Games
2. Download Games
3. Online Games
4. Gaming Network
Age Group – The Report Studies the South Korea Number of Video Game Players in the following 5 Age Groups
1. 18-24
2. 25-34
3. 35-44
4. 45-54
5. 55-64
Gender – The Report provides the Korea Video Game Player Numbers in both the Genders
• Male
• Female
Income – The Report Studies the Video Game Numbers by 3 Income Segments
• Low Income
• Medium Income
• High Income
All the company covered in the report has been covered from 3 viewpoints
• Overview
• Initiatives & Recent Developments
• Revenue
Company Profile
1. Netmarble Corp.
2. Gravity Co. Ltd.
3. DoubleU Games
4. Activision Blizzard
5. NHN Entertainment Corp.
If the information you seek is not included in the current scope of the study kindly share your specific requirements with our custom research team at info@renub.com
1. Introduction
2. Research & Methodology
3. Executive Summary
4. Market Dynamics
4.1 Growth Drivers
4.2 Challenges
5. South Korea Video Game Market
6. Market & Users Share – South Korea Video Game Market
6.1 Category Market Share
6.2 Users Share
6.3 Age Group Share
6.4 Gender Share
6.5 Income Share
7. Category – South Korea Video Game Market
7.1 Mobile Games
7.2 Download Games
7.3 Online Games
7.4 Gaming Networks
8. Users – South Korea Video Game Numbers
8.1 Mobile Games
8.2 Download Games
8.3 Online Games
8.4 Gaming Networks
9. Age Group – South Korea Video Game Numbers
9.1 18 -24 Years
9.2 25-34 years
9.3 35 - 44 years
9.4 45 -54 years
9.5 55 - 64 years
10. Gender - South Korea Video Game Numbers
10.1 Male
10.2 Female
11. Income - South Korea Video Game Numbers
11.1 Low income
11.2 Medium Income
11.3 High Income
12. Company Analysis
12.1 Netmarble Corp.
12.1.1 Overview
12.1.2 Initiatives & Recent Developments
12.1.3 Revenue
12.2 Gravity Co. Ltd.
12.2.1 Overview
12.2.2 Initiatives & Recent Developments
12.2.3 Revenue
12.3 DoubleU Games
12.3.1 Overview
12.3.2 Initiatives & Recent Developments
12.3.3 Revenue
12.4 Activision Blizzard
12.4.1 Overview
12.4.2 Initiatives & Recent Developments
12.4.3 Revenue
12.5 NHN Entertainment Corp.
12.5.1 Overview
12.5.2 Initiatives & Recent Developments
12.5.3 Revenue
List of Figures:
Figure 1: South Korea – Number of Internet Users (Millions), 2015 – 2019
Figure 2: South Korea – Video Game Market (Million US$), 2017 – 2019
Figure 3: South Korea – Forecast for Video Game Market (Million US$), 2020 – 2026
Figure 4: South Korea – Video Game Market Share by Age Group (%), 2017 – 2019
Figure 5: South Korea – Forecast for Video Game Market Share by Age Group (%), 2020 – 2026
Figure 6: South Korea – Video Game Market Share by Gender (%), 2017 – 2019
Figure 7: South Korea – Forecast for Video Game Market Share by Gender (%), 2020 – 2026
Figure 8: South Korea – Video Game Market Share by Income (%), 2017 – 2019
Figure 9: South Korea – Forecast for Video Game Market Share by Income (%), 2020 – 2026
Figure 10: South Korea – Video Game Market by Mobile Games (Million US$), 2017 – 2019
Figure 11: South Korea – Forecast for Video Game Market by Mobile Games (Million US$), 2020 - 2026
Figure 12: South Korea – Video Game Market by Download Game (Million US$), 2017 – 2019
Figure 13: South Korea – Forecast for Video Game Market by Download Game (Million US$), 2020 – 2026
Figure 14: South Korea – Online Video Game Market by Online Game (Million US$), 2017 – 2019
Figure 15: South Korea – Forecast for Online Video Game Market by Online Game (Million US$), 2020 – 2026
Figure 16: South Korea – Video Game Market by Gaming Networks (Million US$), 2017 – 2019
Figure 17: South Korea – Forecast for Video Game Market by Gaming Network (Million US$), 2020 – 2026
Figure 18: South Korea – Video Game Market by Consoles (Million US$), 2017 – 2019
Figure 19: South Korea – Forecast for Video Game Market by Consoles (Million US$), 2020 – 2026
Figure 20: Most played games in PC bangs based on time spent in South Korea as of March 2020
Figure 21: South Korea – Video Game Market by PC Games (Million US$), 2017 – 2019
Figure 22: South Korea – Forecast for Video Game Market by PC Games (Million US$), 2020 – 2026
Figure 23: South Korea – Video Game Users by Mobile Game (Million), 2017 – 2019
Figure 24: South Korea – Forecast for Video Game Users by Mobile Game (Million), 2020 – 2026
Figure 25: South Korea – Video Game Users by Download Games (Million), 2017 – 2019
Figure 26: South Korea – Forecast for Video Game Users by Download Game (Million), 2020 – 2026
Figure 27: South Korea Internet Users & Population in Millions, 2015 - 2019
Figure 28: South Korea – Video Games Users by Online Games (Million), 2017 – 2019
Figure 29: South Korea – Forecast for Video Game Users by Online Games (Million), 2020 – 2026
Figure 30: South Korea – Video Game Users by Gaming Network (Million), 2017 – 2019
Figure 31: South Korea – Forecast for Video Game User by Gaming Network (Million), 2020 – 2026
Figure 32: South Korea – Video Game Users by Consoles (Million), 2017 – 2019
Figure 33: South Korea – Forecast for Video Game User by Consoles (Million), 2020 – 2026
Figure 34: South Korea – Video Game Users by PC Games (Million), 2017 – 2019
Figure 35: South Korea – Forecast for Video Game User by PC Games (Million), 2020 – 2026
Figure 36: Distribution of professional gamers in the 10 major e-sports teams in South Korea in 2017, by annual salary level
Figure 37: Global – Netmarble Corporation Revenue (Million US$), 2017 – 2019
Figure 38: Global – Forecast for Netmarble Corporation Revenue (Million US$), 2020 – 2026
Figure 39: Global – Gravity Co. Ltd. Revenue (Million US$), 2017 – 2019
Figure 40: Global – Forecast for Gravity Co. Ltd. Revenue (Million US$), 2020 – 2026
Figure 41: Global – DoubleU Games Revenue (Million US$), 2017 – 2019
Figure 42: Global – Forecast for DoubleU Games Revenue (Million US$), 2020 – 2026
Figure 43: Global – Activision Blizzard Revenue (Million US$), 2017 – 2019
Figure 44: Global – Forecast for Activision Blizzard Revenue (Million US$), 2020 – 2026
Figure 45: Global – NHN Entertainment Company Revenue (Million US$), 2017 – 2019
Figure 46: Global – Forecast for NHN Entertainment Company Revenue (Million US$), 2020 – 2026
List of Tables:
Table 1: South Korea – Video Game Market Share by Category (%), 2017 – 2019
Table 2: South Korea – Forecast for Video Game Market Share by Category (%), 2020 – 2026
Table 3: South Korea – Video Game Market Share by Users (%), 2017 – 2019
Table 4: South Korea – Forecast for Video Game Market Share by Users (%), 2020 – 2026
Table 5: The top Mobile Games downloaded in South Korea, 2020
Table 6: South Korea – Video Game Market by Age Group (Million), 2017 – 2019
Table 7: South Korea – Forecast for Video Game Market by Age Group (Million), 2020 – 2026
Table 8: South Korea – Video Game Market by Gender (Million), 2017 – 2019
Table 9: South Korea – Forecast for Video Game Market by Gender (Million), 2020 – 2026
Table 10: South Korea – Video Game Market by Income (Million), 2017 – 2019
Table 11: South Korea – Forecast for Video Game Market by Income (Million), 2020 – 2026
Reach out to us
Call us on
USA: +1-678-302-0700
INDIA: +91-120-421-9822
Drop us an email at
info@renub.com