Indonesia Milk Powder Market, Impact of COVID-19, Industry Trends by Production, Consumption, Growth, Opportunity Company Analysis
Buy NowGet Free Customization in This Report
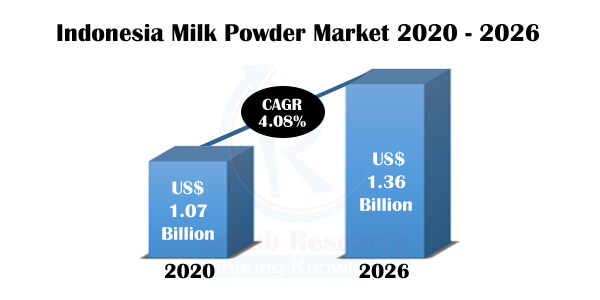
Indonesia remains one of the most diverse regions in economic growth, changing food consumption preferences and relative availability of resources. Indonesia has been experiencing up surge in demand for dairy milk powder products. Apart from that, domestic milk powder consumption per capita and sales have been growing steadily. In Indonesia, milk powder products are considered a convenient way to stay healthy, and demand for perceived milk powder has grown in recent years. Due to the rising number of middle-class consumers, higher household incomes and increasing health consciousness among Indonesian consumers have consumed more and more whole milk powder and skimmed milk powder. According to Renub Research, Indonesia Milk Powder Market is expected to be US$ 1.36 Billion by 2026.

Besides, Milk Powder has several nutrients say vitamin B12, thiamin, and high amounts of protein powder. Milk powder is easy to carry while travelling and can be easily used by mixing in it. The need for processed and packaged food products among working people is more due to their busy schedule and easy availability of ready-to-drink. The Indonesian dairy industry is set for growth as consumers shift their health and dietary habits while the government seeks to expand their local Milk powder product. For the year 2020, Indonesia Milk Powder Market Size was US$ 1.07 Billion for the year 2020.
The Dairy sector of Indonesia remains stifled by a deficiency of quality dairy genetics for its dairy cattle population. However, Indonesian whole milk powder production continues to rise with a growth rate of 5.8% by the end of the year 2026. The whole milk powder is applicable for use in several dairy products like cheese, butter, yoghurt and bakery. Despite the rapid production, growing local demand has also led to imports in Indonesia, particularly milk powder. Ongoing challenges and continuing rise in demand for regional Milk powder products are expected to increase market share for imported products. Currently, the top exporters of milk powder products to Indonesia are the US, E.U., New Zealand, Australia, Malaysia and China.
Retail channels, including hypermarket and supermarket chains, were the most prominent distribution channel for the milk products segment in Indonesia. The imported products reach the end customers through hypermarkets and supermarkets. Increase in the development of E-commerce platforms, the online sale of milk powder products is expected to grow over the long term in Indonesia. As per our research findings, the Indonesia Milk Powder Industry is expected to grow with a CAGR of 4.08% from 2020 to 2026.
Despite hurdles presented by COVID-19, many large cooperatives report that dairy processor demand for fresh milk has continued to increase. The COVID-19 has been affecting economies and industries globally due to lockdowns, travel bans, and business shutdowns. The shutdown of various plants and factories has affected the global supply chains and negatively impacted the manufacturing, delivery schedules, and sales of products in the global market impact of the milk powder business.

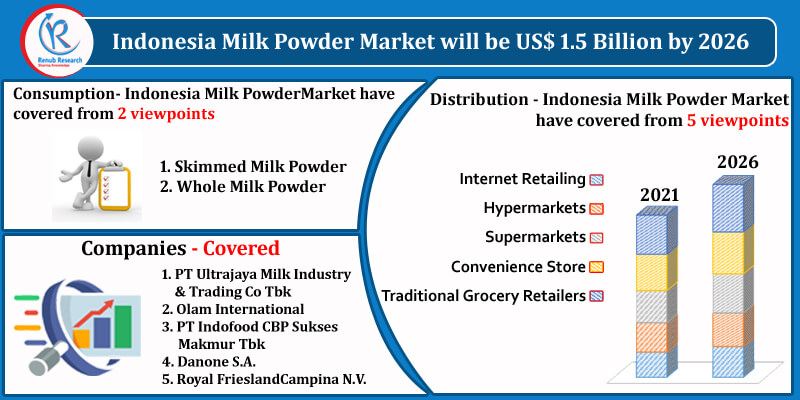
Key companies focus on new product launches with natural or organic claims as to their crucial marketing strategy. For instance, in 2020, Friesland has announced plans to build a new dairy plant and distribution center for Frisian Flag Indonesia in Jakarta for producing condensed and pasteurized milk. Indonesia milk powder is moderately fragmented with a large number of players like PT Ultrajaya Milk Industry & Trading Co Tbk, Olam International, PT Indofood CBP Sukses Makmur Tbk, Danone S.A., Royal Friesland Campina N.V.
Renub Research report titled "Indonesia Milk Powder, by Production (Whole Milk Powder), Consumption (Skimmed Milk Powder, Whole Milk Powder), Import (Skimmed Milk Powder, Whole Milk Powder), Export (Skimmed Milk Powder, Whole Milk Powder), Export by Regions (United States, EU 28,New Zealand, Australia, Other Countries), Distribution (Internet Retailing, Hypermarkets, Supermarkets,Convenience Store, Traditional Grocery Retailers), Company (PT Ultrajaya Milk Industry & Trading Co Tbk, Olam International, PT Indofood CBP Sukses Makmur Tbk, Danone S.A., Royal FrieslandCampina N.V.)" provides an all-encompassing analysis on the Indonesia Milk PowderIndustry.
Production - Indonesia Milk Powder Market have covered from 1 viewpoints
1. Whole Milk Powder
Consumption- Indonesia Milk PowderMarket have covered from 2 viewpoints
1. Skimmed Milk Powder
2. Whole Milk Powder
Import - Indonesia Milk Powder Volume have covered from 2 viewpoints
1. Skimmed Milk Powder
2. Whole Milk Powder
Export - Indonesia Milk Powder Market have covered from 2 viewpoints
1. Skimmed Milk Powder
2. Whole Milk Powder

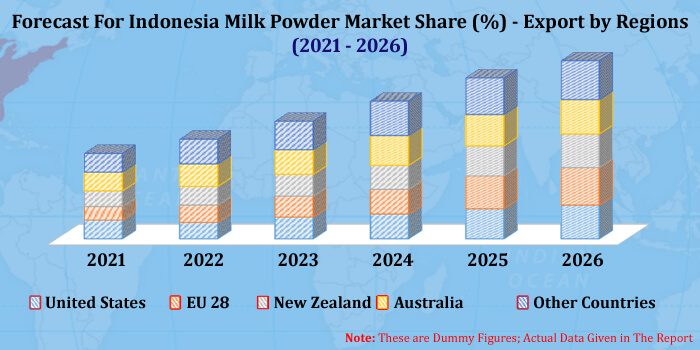
Export by Regions - Indonesia Milk Powder Market have covered from 5 viewpoints
1. United States
2. EU 28
3. New Zealand
4. Australia
5. Other Countries
Distribution - Indonesia Milk Powder Market have covered from 5 viewpoints
1. Internet Retailing
2. Hypermarkets
3. Supermarkets
4. Convenience Store
5. Traditional Grocery Retailers
Company Insights:
• Overview
• Recent Development
• Financial Insight
Company Analysis
1. PT Ultrajaya Milk Industry & Trading Co Tbk
2. Olam International
3. PT Indofood CBP Sukses Makmur Tbk
4. Danone S.A.
5. Royal FrieslandCampina N.V.
1. Introduction
2. Research Methodology
3. Executive Summary
4. Market Dynamics
4.1 Growth Drivers
4.2 Challenges
5. Indonesia Milk Powder Market
5.1 Consumption Analysis
5.1.1 Consumption Market
5.1.2 Consumption Volume
5.2 Import Analysis
5.2.1 Import Market
5.2.2 Import Volume
6. Market Share Analysis – Indonesia Milk Powder
6.1 By Consumption
6.2 By Import
6.3 By Distribution
6.4 Countries Exporting Milk Powder in Indonesia
7. Volume Share Analysis – Indonesia Milk Powder
7.1 By Consumption
7.2 By Import
8. Production - Indonesia Milk Powder
8.1 Whole Milk Powder
8.1.1 Market
8.1.2 Volume
9. Consumption - Indonesia Milk Powder
9.1 Skimmed Milk Powder
9.1.1 Market
9.1.2 Volume
9.2 Whole Milk Powder
9.2.1 Market
9.2.2 Volume
10. Import - Indonesia Milk Powder
10.1 Skimmed Milk Powder
10.1.1 Market
10.1.2 Volume
10.2 Whole Milk Powder
10.2.1 Market
10.2.2 Volume
11. Export - Indonesia Milk Powder
11.1 Skimmed Milk Powder Volume
11.2 Whole Milk Powder Volume
12. Export by Regions - Indonesia Milk Powder
12.1 Export by United States
12.1.1 Market
12.1.2 Volume
12.2 Export by EU 28
12.2.1 Market
12.2.2 Volume
12.3 Export by New Zealand
12.3.1 Market
12.3.2 Volume
12.4 Export by Australia
12.4.1 Market
12.4.2 Volume
12.5 Export by Other Countries
12.5.1 Market
12.5.2 Volume
13. Distribution - Indonesia Milk Powder
13.1 Internet Retailing
13.1.1 Market
13.1.2 Volume
13.2 Hypermarkets
13.2.1 Market
13.2.2 Volume
13.3 Supermarkets
13.3.1 Market
13.3.2 Volume
13.4 Convenience Store
13.4.1 Market
13.4.2 Volume
13.5 Traditional Grocery Retailers
13.5.1 Market
13.5.2 Volume
14. Company Analysis
14.1 PT Ultrajaya Milk Industry & Trading Co Tbk
14.1.1 Overview
14.1.2 Recent Development
14.1.3 Financial Insight
14.2 Olam International
14.2.1 Overview
14.2.2 Recent Development
14.2.3 Financial Insight
14.3 PT Indofood CBP Sukses Makmur Tbk
14.3.1 Overview
14.3.2 Recent Development
14.3.3 Financial Insight
14.4 Danone S.A.
14.4.1 Overview
14.4.2 Recent Development
14.4.3 Financial Insight
14.5 Royal FrieslandCampina N.V.
14.5.1 Overview
14.5.2 Recent Development
14.5.3 Financial Insight
List Of Figures:
Figure-01: Indonesia Milk Powder Consumption Market (Million US$), 2016 – 2020
Figure-02: Forecast for – Indonesia Milk Powder Consumption Market (Million US$), 2021 – 2026
Figure-03: Indonesia Milk Powder Consumption Volume (Thousand MT), 2016 – 2020
Figure-04: Forecast for – Indonesia Milk Powder Consumption Volume (Thousand MT), 2021 – 2026
Figure-05: Indonesia Milk Powder Import Market (Million US$), 2016 – 2020
Figure-06: Forecast for – Indonesia Milk Powder Import Market (Million US$), 2021 – 2026
Figure-07: Indonesia Milk Powder Import Volume (Thousand MT), 2016 – 2020
Figure-08: Forecast for – Indonesia Milk Powder Import Volume (Thousand MT), 2021 – 2026
Figure-09: Production – Whole Milk Powder Market (Million US$), 2016 – 2020
Figure-10: Production – Forecast for 0Whole Milk Powder Market (Million US$), 2021 – 2026
Figure-11: Production – Whole Milk Powder Volume (Thousand Tons), 2016 – 2020
Figure-12: Production – Forecast for Whole Milk Powder Volume (Thousand Tons), 2021 – 2026
Figure-13: Consumption – Skimmed Milk Powder Market (Million US$), 2016 – 2020
Figure-14: Consumption – Forecast for Skimmed Milk Powder Market (Million US$), 2021 – 2026
Figure-15: Consumption – Skimmed Milk Powder Volume (Thousand Tons), 2016 – 2020
Figure-16: Consumption – Forecast for Skimmed Milk Powder Volume (Thousand Tons), 2021 – 2026
Figure-17: Consumption – Whole Milk Powder Market (Million US$), 2016 – 2020
Figure-18: Consumption – Forecast for Whole Milk Powder Market (Million US$), 2021 – 2026
Figure-19: Consumption – Whole Milk Powder Volume (Thousand Tons), 2016 – 2020
Figure-20: Consumption – Forecast for Whole Milk Powder Volume (Thousand Tons), 2021 – 2026
Figure-21: Import – Skimmed Milk Powder Market (Million US$), 2016 – 2020
Figure-22: Import – Forecast for Skimmed Milk Powder Market (Million US$), 2021 – 2026
Figure-23: Import – Skimmed Milk Powder Volume (Thousand Tons), 2016 – 2020
Figure-24: Import – Forecast for Skimmed Milk Powder Volume (Thousand Tons), 2021 – 2026
Figure-25: Import – Whole Milk Powder Market (Million US$), 2016 – 2020
Figure-26: Import – Forecast for Whole Milk Powder Market (Million US$), 2021 – 2026
Figure-27: Import – Whole Milk Powder Volume (Thousand Tons), 2016 – 2020
Figure-28: Import – Forecast for Whole Milk Powder Volume (Thousand Tons), 2021 – 2026
Figure-29: Export – Skimmed Milk Powder Volume (Thousand Tons), 2016 – 2020
Figure-30: Export – Whole Milk Powder Volume (Thousand Tons), 2016 – 2020
Figure-31: Export by United States – Indonesia Milk Powder Market (Million US$), 2016 – 2020
Figure-32: Export by United States – Forecast for Indonesia Milk Powder Market (Million US$), 2021 – 2026
Figure-33: Export by United States – Indonesia Milk Powder Volume (Thousand MT), 2016 – 2020
Figure-34: Export by United States – Forecast for Indonesia Milk Powder Volume (Thousand MT), 2021 – 2026
Figure-35: Export by EU 28 – Indonesia Milk Powder Market (Million US$), 2016 – 2020
Figure-36: Export by EU 28 – Forecast for Indonesia Milk Powder Market (Million US$), 2021 – 2026
Figure-37: Export by EU 28 – Indonesia Milk Powder Volume (Thousand MT), 2016 – 2020
Figure-38: Export by EU 28 – Forecast for Indonesia Milk Powder Volume (Thousand MT), 2021 – 2026
Figure-39: Export by New Zealand – Indonesia Milk Powder Market (Million US$), 2016 – 2020
Figure-40: Export by New Zealand – Forecast for Indonesia Milk Powder Market (Million US$), 2021 – 2026
Figure-41: Export by New Zealand – Indonesia Milk Powder Volume (Thousand MT), 2016 – 2020
Figure-42: Export by New Zealand – Forecast for Indonesia Milk Powder Volume (Thousand MT), 2021 – 2026
Figure-43: Export by Australia – Indonesia Milk Powder Market (Million US$), 2016 – 2020
Figure-44: Export by Australia – Forecast for Indonesia Milk Powder Market (Million US$), 2021 – 2026
Figure-45: Export by Australia – Indonesia Milk Powder Volume (Thousand MT), 2016 – 2020
Figure-46: Export by Australia – Forecast for Indonesia Milk Powder Volume (Thousand MT), 2021 – 2026
Figure-47: Export by Other Countries – Indonesia Milk Powder Market (Million US$), 2016 – 2020
Figure-48: Export by Other Countries – Forecast for Indonesia Milk Powder Market (Million US$), 2021 – 2026
Figure-49: Export by Other Countries – Indonesia Milk Powder Volume (Thousand MT), 2016 – 2020
Figure-50: Export by Other Countries – Forecast for Indonesia Milk Powder Volume (Thousand MT), 2021 – 2026
Figure-51: Distribution – Internet Retailing Market (Million US$), 2016 – 2020
Figure-52: Distribution – Forecast for Internet Retailing Market (Million US$), 2021 – 2026
Figure-53: Distribution – Internet Retailing Volume (Thousand MT), 2016 – 2020
Figure-54: Distribution – Forecast for Internet Retailing Volume (Thousand MT), 2021 – 2026
Figure-55: Distribution – Hypermarkets Market (Million US$), 2016 – 2020
Figure-56: Distribution – Forecast for Hypermarkets Market (Million US$), 2021 – 2026
Figure-57: Distribution – Hypermarkets Volume (Thousand MT), 2016 – 2020
Figure-58: Distribution – Forecast for Hypermarkets Volume (Thousand MT), 2021 – 2026
Figure-59: Distribution – Supermarkets Market (Million US$), 2016 – 2020
Figure-60: Distribution – Forecast for Supermarkets Market (Million US$), 2021 – 2026
Figure-61: Distribution – Supermarkets Volume (Thousand MT), 2016 – 2020
Figure-62: Distribution – Forecast for Supermarkets Volume (Thousand MT), 2021 – 2026
Figure-63: Distribution – Convenience Store Market (Million US$), 2016 – 2020
Figure-64: Distribution – Forecast for Convenience Store Market (Million US$), 2021 – 2026
Figure-65: Distribution – Convenience Store Volume (Thousand MT), 2016 – 2020
Figure-66: Distribution – Forecast for Convenience Store Volume (Thousand MT), 2021 – 2026
Figure-67: Distribution – Traditional Grocery Retailers Market (Million US$), 2016 – 2020
Figure-68: Distribution – Forecast for Traditional Grocery Retailers Market (Million US$), 2021 – 2026
Figure-69: Distribution – Traditional Grocery Retailers Volume (Thousand MT), 2016 – 2020
Figure-70: Distribution – Forecast for Traditional Grocery Retailers Volume (Thousand MT), 2021 – 2026
Figure-71: PT Ultrajaya Milk Industry & Trading Co Tbk – Global Revenue (Million US$), 2016 – 2020
Figure-72: PT Ultrajaya Milk Industry & Trading Co Tbk – Forecast for Global Revenue (Million US$), 2021 – 2026
Figure-73: Olam International – Global Revenue (Billion US$), 2016 – 2020
Figure-74: Olam International – Forecast for Global Revenue (Billion US$), 2021 – 2026
Figure-75: PT Indofood CBP Sukses Makmur Tbk – Global Revenue (Billion US$), 2016 – 2020
Figure-76: PT Indofood CBP Sukses Makmur Tbk – Forecast for Global Revenue (Billion US$), 2021 – 2026
Figure-77: Danone S.A. – Global Revenue (Billion US$), 2016 – 2020
Figure-78: Danone S.A. – Forecast for Global Revenue (Billion US$), 2021 – 2026
Figure-79: Royal FrieslandCampina N.V. – Global Revenue (Billion US$), 2016 – 2020
Figure-80: Royal FrieslandCampina N.V. – Forecast for Global Revenue (Billion US$), 2021 – 2026
List Of Tables:
Table-01: Indonesia Milk Powder Market Share by Consumption (Percent), 2016 – 2020
Table-02: Forecast for – Indonesia Milk Powder Market Share by Consumption (Percent), 2021 – 2026
Table-03: Indonesia Milk Powder Market Share by Import (Percent), 2016 – 2020
Table-04: Forecast for – Indonesia Milk Powder Market Share by Import (Percent), 2021 – 2026
Table-05: Indonesia Milk Powder Market Share by Distribution (Percent), 2016 – 2020
Table-06: Forecast for – Indonesia Milk Powder Market Share by Distribution (Percent), 2021 – 2026
Table-07: Indonesia Milk Powder Market Share by Countries Exporting (Percent), 2016 – 2020
Table-08: Forecast for – Indonesia Milk Powder Market Share by Countries Exporting (Percent), 2021 – 2026
Table-09: Indonesia Milk Powder Volume Share by Consumption (Percent), 2016 – 2020
Table-10: Forecast for – Indonesia Milk Powder Volume Share by Consumption (Percent), 2021 – 2026
Table-11: Indonesia Milk Powder Volume Share by Import (Percent), 2016 – 2020
Table-12: Forecast for – Indonesia Milk Powder Volume Share by Import (Percent), 2021 – 2026
Reach out to us
Call us on
USA: +1-478-202-3244
INDIA: +91-120-421-9822
Drop us an email at
info@renub.com