United States Modular Kitchen Market, By Design, Distribution Channels (Online, Offline), Products (Tall Storage, Floor Cabinet, Wall Cabinet), Regions, & Company Analysis
Buy NowGet Free Customization in this Report
The kitchen plays a vital role, and it is one of the essential areas in a home; it has evolved from the traditional kitchen to modular kitchen over the last decade, particularly in the United States. Kitchen is used to store all food items, utensils, spices and kitchen electronics. Modular kitchens advantages are time-saving, energy efficiency as well as convenience in food preparation. According to Renub Research analysis United States Modular Kitchen Market is expected to be more than US$ 9 Billion by the end of the year 2026.

Growing demand for the personalized and customized kitchen is propelling modular kitchen market in the United States as they are influencing purchasing decision of consumers. As a result, vendors are also providing personalized kitchens with innovative designs. With the rise of IoT devices, use of technology is growing in the United States modular kitchen industry. Connectivity is quickly spreading to the kitchen and beyond from the living room. Advanced technology integrated into modular kitchen serves as a personal nutritionist, which helps to achieve nuanced health objectives in a more efficient manner. Besides, a growing number of residential homes and partnerships between modular kitchen manufacturers and real estate developers is also going to augment the modular kitchen market in the United States.
Pandemic COVID-19 Impact on the United States Modular Kitchen Market
Modular kitchen industry has been witnessing inconsistent growth, since the COVID-19 pandemic. Due to the result of the ongoing pandemic crisis, there has been a decline in the overall performance of discretionary products such as furniture fixtures, home decor products etc. However, we expect this decline to be temporary in nature and modular kitchen market to start reviving from Q4 2020.
Major companies operating in the United States modular kitchen market include IKEA, Häfele, Hettich Group, Nobia AB.
Renub Research report titled "United States Modular Kitchen Market, By Design (Straight, L-Shape, U-Shape, and other), Distribution Channels (Online, Offline), Products (Tall Storage, Floor Cabinet, and Wall Cabinet) Region (South, West, Midwest and North East) and Company Analysis (IKEA, Häfele, Hettich Group and Nobia AB)” provides a complete analysis of United States Modular Kitchen Industry.
Distribution Channels: Both Distribution Channels are covered in this Report
• Online
• Offline
Design: The market of the following modular kitchen designs are covered in the report:
• L-Shape
• U-Shape
• Straight
• Other Design

Products: On the product basis, the United States Modular Kitchen Market is divided into 3 Segments
• Floor Cabinet
• Wall Cabinet
• Tall Storage
Regions – All the 4 Regions Modular Kitchen Market in United States are Covered
• South
• West
• Midwest
• North East
All the 5 Companies have been Studied from Three Points
• Overview
• Recent Developments & Strategy
• Sales Analysis
Company Analysis in this report
• IKEA
• Häfele
• Hettich Group
• Nobia AB
If the information you seek is not included in the current scope of the study kindly share your specific requirements with our custom research team at info@renub.com
1. Introduction
2. Research & Methodology
3. Executive Summary
4. Market Dynamic
4.1 Growth Driver
4.2 Challenges
5. United States Modular Kitchen Market
6. Market Share – United States Modular Kitchen
6.1 By Distribution Channels
6.2 By Design
6.3 By Products
6.4 By Region
7. Products - United States Modular Kitchen Market
7.1 Floor Cabinet
7.2 Wall Cabinet
7.3 Tall Storage
8. Design - United States Modular Kitchen Market
8.1 L Shape
8.2 U Shape
8.3 Straight
8.4 Other Designs
9. Distribution Channels - United States Modular Kitchen Market
9.1 Online
9.2 Offline
10. Regions – United States Modular Kitchen Market
10.1 South
10.2 West
10.3 Midwest
10.4 North east
11. Merger & Acquisitions
12. Company Analysis
12.1 IKEA
12.1.1 Overview
12.1.2 Recent Development
12.1.3 Sales Analysis
12.2 Häfele
12.2.1 Overview
12.2.2 Recent Development
12.2.3 Sales Analysis
12.3 Hettich Group
12.3.1 Overview
12.3.2 Recent Development
12.3.3 Sales Analysis
12.4 Nobia AB
12.4.1 Overview
12.4.2 Recent Development
12.4.3 Sales Analysis
List of Figures:
Figure-01: United States – Modular Kitchen Market (Million US$), 2019 – 2026
Figure-02: United States – Modular Kitchen Market (Million US$), 2015 – 2019
Figure-03: United States – Forecast for Modular Kitchen Market (Million US$), 2020 – 2026
Figure-04: United States – Modular Kitchen Market Share Analysis by Distribution Channels (Percent), 2015 – 2019
Figure-05: United States – Forecast for Modular Kitchen Market Share Analysis by Distribution Channels (Percent), 2020 – 2026
Figure-06: United States – Modular Kitchen Market Share Analysis by Design (Percent), 2015 – 2019
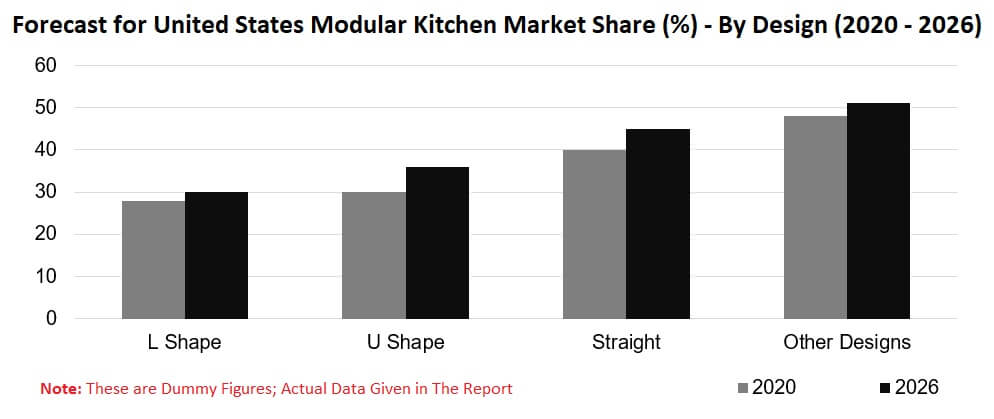
Figure-07: United States – Forecast for Modular Kitchen Market Share Analysis by Design (Percent), 2020 – 2026
Figure-08: United States – Modular Kitchen Market Share Analysis by Products (Percent), 2015 – 2019
Figure-09: United States – Forecast for Modular Kitchen Market Share Analysis by Products (Percent), 2020 – 2026
Figure-10: United States – Modular Kitchen Market Share Analysis by Region (Percent), 2015 – 2019
Figure-11: United States – Forecast for Modular Kitchen Market Share Analysis by Region (Percent), 2020 – 2026
Figure-12: By Product – Floor Cabinet Market (Million US$), 2015 – 2019
Figure-13: By Product – Forecast for Floor Cabinet Market (Million US$), 2020 – 2026
Figure-14: By Product – Wall Cabinet Market (Million US$), 2015 – 2019
Figure-15: By Product – Forecast for Wall Cabinet Market (Million US$), 2020 – 2026
Figure-16: By Product – Tall Storage Market (Million US$), 2015 – 2019
Figure-17: By Product – Forecast for Tall Storage Market (Million US$), 2020 – 2026
Figure-18: By Design – L Shape Market (Million US$), 2015 – 2019
Figure-19: By Design – Forecast for L Shape Market (Million US$), 2020 – 2026
Figure-20: By Design – U Shape Market (Million US$), 2015 – 2019
Figure-21: By Design – Forecast for U Shape Market (Million US$), 2020 – 2026
Figure-22: By Design – Straight Shape Market (Million US$), 2015 – 2019
Figure-23: By Design – Forecast for Straight Shape Market (Million US$), 2020 – 2026
Figure-24: By Design – Other Shape Market (Million US$), 2015 – 2019
Figure-25: By Design – Forecast for Other Shape Market (Million US$), 2020 – 2026
Figure-26: By Distribution Channels – Online Market (Million US$), 2015 – 2019
Figure-27: By Distribution Channels – Forecast for Online Market (Million US$), 2020 – 2026
Figure-28: By Distribution Channels – Offline Market (Million US$), 2015 – 2019
Figure-29: By Distribution Channels – Forecast for Offline Market (Million US$), 2020 – 2026
Figure-30: South Region – Modular Kitchen Market (Million US$), 2015 – 2019
Figure-31: South Region – Forecast for Modular Kitchen Market (Million US$), 2020 – 2026
Figure-32: West Region – Modular Kitchen Market (Million US$), 2015 – 2019
Figure-33: West Region – Forecast for Modular Kitchen Market (Million US$), 2020 – 2026
Figure-34: Midwest Region – Modular Kitchen Market (Million US$), 2015 – 2019
Figure-35: Midwest Region – Forecast for Modular Kitchen Market (Million US$), 2020 – 2026
Figure-36: Northeast Region – Modular Kitchen Market (Million US$), 2015 – 2019
Figure-37: Northeast Region – Forecast for Modular Kitchen Market (Million US$), 2020 – 2026
Figure-38: Global – Ikea Group Sales (Billion US$), 2016 – 2019
Figure-39: Global – Forecast for Ikea Group Sales (Billion US$), 2020 – 2026
Figure-40: Global- Häfele GmbH & Co KG Sales (Million US$), 2016 – 2019
Figure-41: Global – Forecast for Häfele GmbH & Co KG Sales (Million US$), 2020 – 2026
Figure-42: Global – Hettich Group Sales (Million US$), 2016 – 2019
Figure-43: Global – Forecast for Hettich Group Sales (Million US$), 2020 – 2025
Figure-44: Global – Nobia AB Company Sales (Million US$), 2016 – 2019
Figure-45: Global – Forecast for Nobia AB Company Sales (Million US$), 2020 – 2025
List of Tables:
Table-01: South Region Cities Real Estate Survey with Scale 1 to 5 (Year 2019)
Table-02: West Region Cities Survey with Scale 1 to 5 (Year 2019)
Table-03: Midwest Region Cities Survey with Scale 1 to 5 (Year 2019)
Table-04: Northeast Region Cities Survey with Scale 1 to 5 (Year 2019)
Reach out to us
Call us on
USA: +1-478-202-3244
INDIA: +91-120-421-9822
Drop us an email at
info@renub.com